Algo Trading 101 for Dummies like Me
Here’s an attempt to describe the Algo Trading business in layman’s terms. Let’s split the phrase into words — Algoand TradingAs you may already know, the word Trading here stands for the action of buying and selling stocks in the capital markets whereas Algo here stands for the termAlgorithmic. If you already know what an algorithm is, you can skip the next paragraph.
An algorithm is a clearly defined step-by-step set of operations to be performed. Let’s say if you are assigned a task to drink water from a bottle, the algorithm or set of operations for that will be — to get the water bottle, open the cap, drink the water, close the cap and place the bottle at the right place. Simple. Similarly in a computer system, when you need a machine to do something for you, you explain the job clearly by setting instructions for it to execute. And that process is also called programming a computer.
Now, many of you might already know that before the electronic trading took over, the stock trading was mainly a paper-based activity. There were actual stock certificates and one needed to be physically present there to buy or sell stocks. And then there was dematerialization(DEMAT). Actual certificates were slowly being replaced by their electronic form as they could be registered or transferred electronically. It increased the fluctuations in the stock-prices because now the trading process was faster. But then with the technological developments came the next big thing — ALGO TRADING. Now, you can write an algorithm and instruct a computer to buy or sell stocks for you when the defined conditions are met. These programmed computers can trade at a speed and frequency that is impossible for a human trader. This process can be semi-automated or completely automated and this is why the terms automated tradingand algo trading are used interchangeably but are not necessarily the same, in the next section we will discuss how they are different from each other.
“All models are wrong but some are useful” -George Box
Difference between algo trading and automated trading
Automated Tradingis often confused with algorithmic trading. Automated Trading is the absolute automation of the trading process. Here decisions about buying and selling are also taken by computer programs. This means the order is automatically created, submitted(to the market) and executed. The automated trading facility is usually utilized by hedge funds that utilize proprietary execution algorithms and trade via Direct-Market Access(DMA) or sponsored access.
High-frequency Trading(HFT) is a subset of automated trading. Technology has made it possible to execute a very large number of orders within seconds. Such speedy trades can last for milliseconds or less. HFT firms earn by trading a really large volume of trades. Clearly speed of execution is the priority here and HFT uses of direct market access to reduce the execution time for transactions. You can also look into this article by Gonçalo Abreu to understand how to assemble an entry-level HFT system.
In short, Algorithmic Tradingis basically an execution process based on a written algorithm, Automated Trading does the same job that its name implies and HFT refers to a specific type of ultra-fast automated trading.
Intelligent Algorithmic Trading Systems
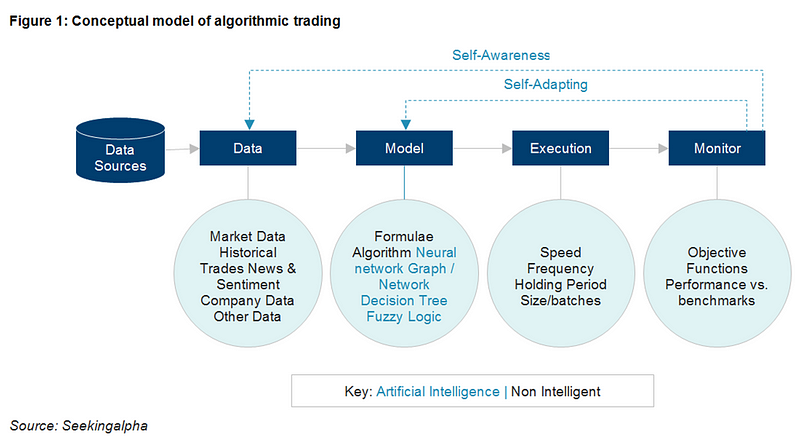
Image Source: https://www.aranca.com/knowledge-library/articles/investment-research/the-ai-revolution-in-banking
Algorithmic trading systems are best understood using a simple conceptual architecture consisting of four components which handle different aspects of the algorithmic trading system namely the data handler, strategy handler, and the trade execution handler. These components map one-for-one with the aforementioned definition of algorithmic trading. We’ll discuss each of the 4 components in detail below:
1.Data Component
Algorithmic Trading systems can use structured data, unstructured data, or both. Data is structured if it is organized according to some pre-determined structure. Examples include spreadsheets, CSV files, JSON files, XML, Databases, and Data-Structures. Market-related data such as inter-day prices, end of day prices, and trade volumes are usually available in a structured format. Economic and company financial data is also available in a structured format. Two good sources for structured financial data are Quandl and Morningstar.
Data is unstructured if it is not organized according to any pre-determined structures. Examples include news, social media, videos, and audio. This type of data is inherently more complex to process and often requires data analytics and data mining techniques to analyze it. Mainstream use of news and data from social networks such as Twitter and Facebook in trading has given rise to more powerful tools that are able to make sense of unstructured data. Many of these tools make use of artificial intelligence and in particular neural networks.
2.Model Component
A model is the representation of the outside world as it is seen by the Algorithmic Trading system. Financial models usually represent how the algorithmic trading system believes the markets work. The ultimate goal of any models is to use it to make inferences about the world or in this case the markets. The most important thing to remember here is the quote from George E.P Box “all models are essentially wrong, but some are useful”.
Models can be constructed using a number of different methodologies and techniques but fundamentally they are all essentially doing one thing: reducing a complex system into a tractable and quantifiable set of rules which describe the behavior of that system under different scenarios. Some approaches include, but are not limited to, mathematical models, symbolic and fuzzy logic systems, decision trees, induction rule sets, and neural networks.
**Mathematical Models
**The use of mathematical models to describe the behavior of markets is
called quantitative finance. Most quantitative finance models work off
of the inherent assumptions that market prices (and returns) evolve over
time according to a stochastic process, in other words, markets are
random. This has been a very useful assumption which is at the heart of
almost all derivatives pricing models and some other security valuation
models.
Essentially most quantitative models argue that the returns of any given
security are driven by one or more random market risk factors. The
degree to which the returns are affected by those risk factors is called
sensitivity. For example, a well-diversified portfolio’s returns may be
driven by the movement of short-term interest rates, various foreign
exchange rates, and the returns in the overall stock market. These
factors can be measured historically and used to calibrate a model which
simulates what those risk factors could do and, by extension, what the
returns on the portfolio might be. For more information please see
Random Walks Down Wall
Street.
**Symoblic and Fuzzy Logic Models
**Symbolic
logic
is a form of reasoning which essentially involves the evaluation of
predicates (logical statements constructed from logical operators such
as AND, OR, and XOR) to either true or false. Fuzzy
logic relaxes the binary true
or false constraint and allows any given predicate to belong to the set
of true and or false predicates to different degrees. This is defined in
terms of set membership functions.
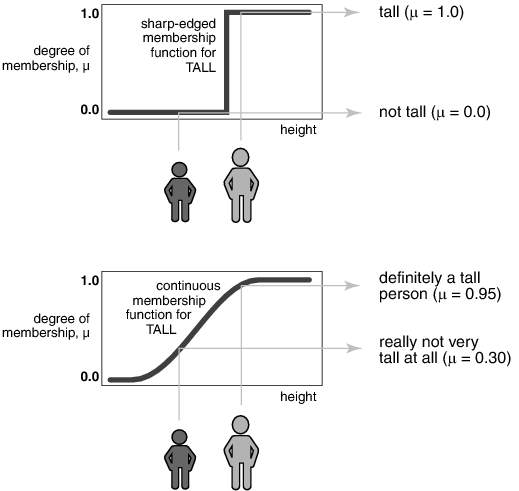
Image Source: https://www.google.com
In the context of financial markets, the inputs into these systems may
include indicators which are expected to correlate with the returns of
any given security. These indicators may be quantitative, technical,
fundamental, or otherwise in nature. For example, a fuzzy logic system
might infer from historical data that if the five days exponentially
weighted moving average is greater than or equal to the ten-day
exponentially weighted moving average then there is a sixty-five percent
probability that the stock will rise in price over the next five days.
A data-mining approach to identifying these rules from a given data set
is called rule induction.
This is very similar to the induction of a decision tree except that the
results are often more human readable.
**Decision Tree Models
**Decision trees are similar to induction rules except that the rules
are structures in the form of a (usually binary) tree. In computer
science, a binary tree is a tree data structure in which each node has
at most two children, which are referred to as the left child and the
right child. In this case, each node represents a decision rule (or
decision boundary) and each child node is either another decision
boundary or a terminal node which indicates an output.
There are two types of decision trees: classification trees and
regression trees. Classification trees contain classes in their outputs
(e.g. buy, hold, or sell) whilst regression trees contain outcome values
for a particular variable (e.g. -2.5%, 0%, +2.5%, etc.). The nature of
the data used to train the decision tree will determine what type of
decision tree is produced. Algorithms used for producing decision trees
include C4.5 and Genetic
Programming.
As with rule induction, the inputs into a decision tree model may
include quantities for a given set of fundamental, technical, or
statistical factors which are believed to drive the returns of
securities.
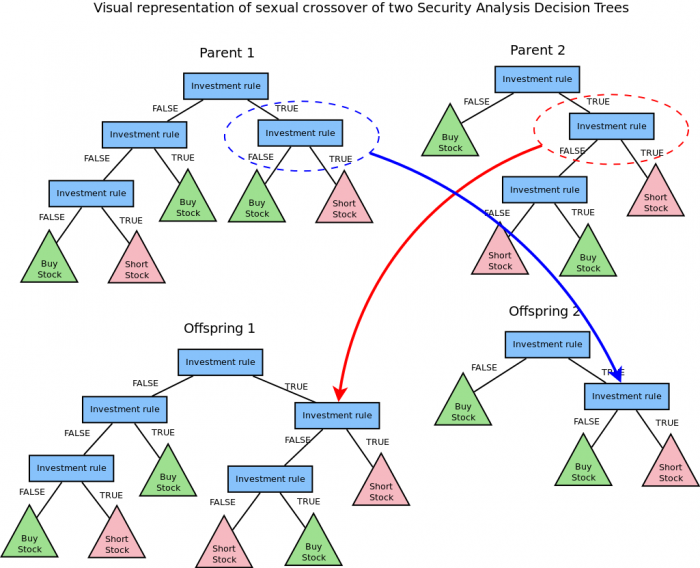
Image Source: https://www.google.com
**Neural Network Models
**Neural networks are almost certainly the most popular machine learning
model available to algorithmic traders. Neural networks consist of
layers of interconnected nodes between inputs and outputs. Individual
nodes are called perceptrons and resemble a multiple linear regression
except that they feed into something called an activation function,
which may or may not be non-linear. In non-recurrent neural networks,
perceptrons are arranged into layers and layers are connected with other
another. There are three types of layers, the input layer, the hidden
layer(s), and the output layer. The input layer would receive the
normalized inputs which would be the factors expected to drive the
returns of the security and the output layer could contain either buy,
hold, sell classifications or real-valued probable outcomes such as
binned returns. Hidden layers essentially adjust the weightings on those
inputs until the error of the neural network (how it performs in a
backtest) is minimized. One interpretation of this is that the hidden
layers extract salient features in the data which have predictive power
with respect to the outputs.
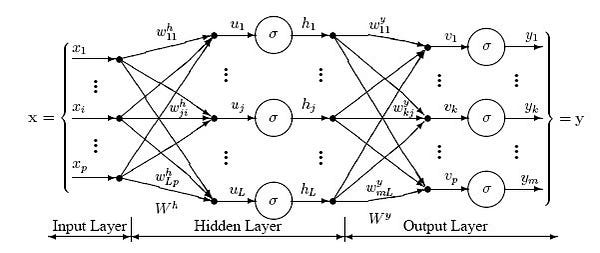
Image Source: https://www.google.com
In addition to these models, there are a number of other decision making
models which can be used in the context of algorithmic trading (and
markets in general) to make predictions regarding the direction of
security prices or, for quantitative readers, to make predictions
regarding the probability of any given move in a securities price.
The choice of model has a direct effect on the performance of the
Algorithmic Trading system. Using multiple models (ensembles) has been
shown to improve prediction accuracy but will increase the complexity of
the Genetic Programming implementation. The model is the brain of the
algorithmic trading system. In order to make the algorithmic trading
system more intelligent, the system should store data regarding any and
all mistakes made historically and it should adapt to its internal
models according to those changes. In some sense, this would constitute
self-awareness (of mistakes) and self-adaptation (continuous model
calibration). That said, this is certainly not a terminator!
3.Execution Component
The execution component is responsible for putting through the trades that the model identifies. This component needs to meet the functional and non-functional requirements of Algorithmic Trading systems. For example, the speed of the execution, the frequency at which trades are made, the period for which trades are held, and the method by which trade orders are routed to the exchange needs to be sufficient. Any implementation of the algorithmic trading system should be able to satisfy those requirements.
4.Monitor Component
Artificial intelligence learns using objective functions. Objective functions are usually mathematical functions which quantify the performance of the algorithmic trading system. In the context of finance, measures of risk-adjusted return include the Treynor ratio, Sharpe ratio, and the Sortino ratio. The model component in the algorithmic trading system would be “asked” to maximize one or more of these quantities. The challenge with this is that markets are dynamic. In other words, the models, logic, or neural networks which worked before may stop working over time. To combat this the algorithmic trading system should train the models with information about the models themselves. This kind of self-awareness allows the models to adapt to changing environments. I think of this self-adaptation as a form of continuous model calibration for combating market regime changes.
Automated Trading Strategies
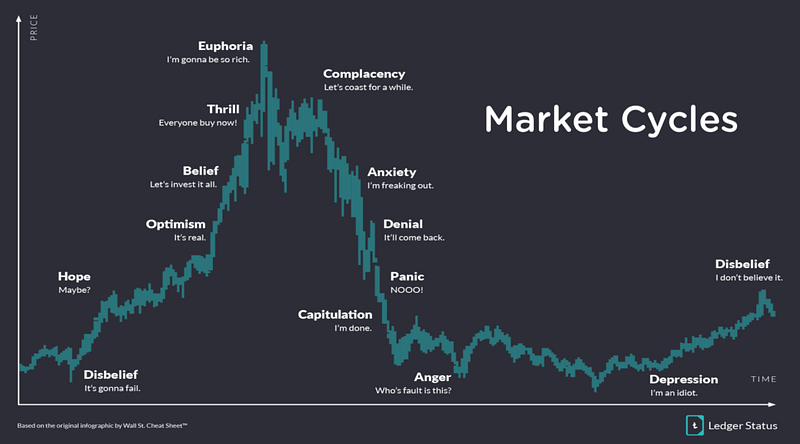
Image Source: https://ledgerstatus.com/cycle-investing/
Market Analysis
Basic techniques include analyzing transaction volumes for given
security to gain a daily profile of trading for that specific security.
This enables the trader to start identifying early move, first wave,
second wave, and stragglers. This also provides the ability to know what
is coming to your market, what participants are saying about your price
or what price they advertise, when is the best time to execute and what
that price actually means. Collecting, handling and having the right
data available is critical, but crucially, depends on your specific
business, meaning that you need a complete but flexible platform.
Comparing volumes today vs previous days can give an early indication of
whether something is happening in the market. Likewise, looking at
trading corridors, i.e. the difference between the best bid and best
offer, and how they evolve over the day can provide valuable insights
that feed into a trading strategy.
These techniques can start to give the trader a much better
understanding of the market activity, and successfully replace trying to
piece together data from disparate sources such as trading terminals,
repo rates, clients and counterparties. As with the game of poker,
knowing what is happening sooner can make all the difference.
Managing Multiple Markets
Simple execution management can be as basic as executing in a way that avoids multiple hits when trading across multiple markets. This can also extend to managing an integrated quote across the markets, rebalancing un-executed quantity on perceived available liquidity.
Passive Aggressive
Another technique is the Passive Aggressive approach across multiple markets. Say you want to buy £100m and put a quote out to market, but the liquidity is not there. If you find a way to source an amount close to the volume you want to buy, you can then execute this ‘almost’ size. The execution system then reduces the quoted amount in the market automatically without trader intervention. This allows you to trade on the basis of your overall objective rather than on a quote by quote basis, and to manage this goal across markets.
Price Divergence From GC
Gaining an immediate notification of what’s trading away from GC gives a real-time view of when a component of the basket is diverging from the basket price. Gaining this understanding more explicitly across markets can provide various opportunities depending on the trading objective.
Trading off Inventory
Integration between the trading system and the global inventory manager
can provide major benefits in defining the trading objective in relation
to a position, where the position can be updated by another party, for
example, a fund manager, or a cash desk.
For example, the position shows a long position of £100m, and the desk
objective is to finance that position. As the day progresses, the
position changes to £80m and the trading objective are automatically
updated to reflect this. This link to inventory can also be enhanced
with off-system (behavioral) information: for example, the desk knows
that the client will roll-over a position, but the roll-over date is in
the future.
Trading Algorithm Pattern Recognition and Randomisers
Counterparty trading activity, including automated trading, can
sometimes create a trail that makes it possible to identify the trading
strategy. Solutions that can use pattern recognition (something that
machine learning is particularly good at) to spot counterparty
strategies can provide value to traders.
Conversely, randomizers built into one’s own trading algorithms can
cloak one’s strategy, meaning counterparts are unable to spot any
discernible logic to the firm’s trading activity and cannot, therefore,
start to trade against you.
Sniping Tools
Anyone who has bid for anything on eBay will know the frustration of
sitting watching an item about to close. Your bid is winning! But at the
last second, another bid suddenly exceeds yours. How is this possible?!
You’ve been snipped.
Automated ‘sniping’ tools, widely available on the internet, can
auto-exceed the highest bid within a defined limit, allowing the user to
avoid having to sit at their PC waiting for a bid to close.
These tools are now coming to the repo market, and mean that correctly
timing trading strategies becomes ever more important.
Not using these tools can lose you trades but can also put the firm’s
liquidity management under duress during times of market stress and
year-end liquidity crunches as the firm repeatedly gets pipped to the
post when trying to source liquidity.
Best Execution & Order Slicing
Best Execution can be defined using different dimensions, for example,
price, liquidity, cost, speed, execution likelihood, etc. An automated
execution tool could, therefore, optimize for whichever of these
parameters are most important or some combination of them.
Likewise breaking orders into smaller chunks that will avoid moving the
market and then timing those orders in a way that ensures optimum
execution can also provide benefits.
Market impact models, increasingly employing artificial intelligence can
evaluate the effect of previous trades on a trade and how the impact
from each trade decays over time. This allows traders to avoid executing
certain trades too closely together, leading to market impact effects
that reduce P&L.
What is Technical Analysis?
Technical Analysis is the forecasting of future financial price movements based on an examination of past price movements. Like weather forecasting, technical analysis does not result in absolute predictions about the future. Instead, technical analysis can help investors anticipate what is “likely” to happen to prices over time. Technical analysis uses a wide variety of charts that show price over time.
Technical analysis is applicable to stocks, indices, commodities, futures or any tradable instrument where the price is influenced by the forces of supply and demand. Price data (or as John Murphy calls it, “market action”) refers to any combination of the open, high, low, close, volume, or open interest for a given security over a specific timeframe. The timeframe can be based on intraday (1-minute, 5-minutes, 10-minutes, 15-minutes, 30-minutes or hourly), daily, weekly or monthly price data and last a few hours or many years.
Key Assumptions of Technical Analysis
Technical analysis is applicable to securities where the price is only influenced by the forces of supply and demand. Technical analysis does not work well when other forces can influence the price of the security. In order to be successful, the technical analysis makes three key assumptions about the securities that are being analyzed:
- High Liquidity: Liquidity is essentially volume. Heavily-traded stocks allow investors to trade quickly and easily, without dramatically changing the price of the stock. Thinly-traded stocks are more difficult to trade, because there aren’t many buyers or sellers at any given time, so buyers and sellers may have to change their desired price considerably in order to make a trade. In addition, low liquidity stocks are often very low priced (sometimes less than a penny per share), which means that their prices can be more easily manipulated by individual investors. These outside forces acting on thinly-traded stocks make them unsuitable for technical analysis.
- No Artificial Price Changes: Splits, dividends, and distributions are the most common “culprits” for artificial price changes. Though there is no difference in the value of the investment, artificial price changes can dramatically affect the price chart and make technical analysis difficult to apply. This kind of price influence from outside sources can be easily addressed by adjusting the historical data prior to the price change.
- No Extreme News: Technical analysis cannot predict extreme events, including business events such as a company’s CEO dying unexpectedly, and political events such as a terrorist act. When the forces of “extreme news” are influencing the price, technicians have to wait patiently until the chart settles down and starts to reflect the “new normal” that results from such news.
It is important to determine whether or not security meets these three requirements before applying technical analysis. That’s not to say that analysis of any stock whose price is influenced by one of these outside forces is useless, but it will affect the accuracy of that analysis.
The Basis of Technical Analysis
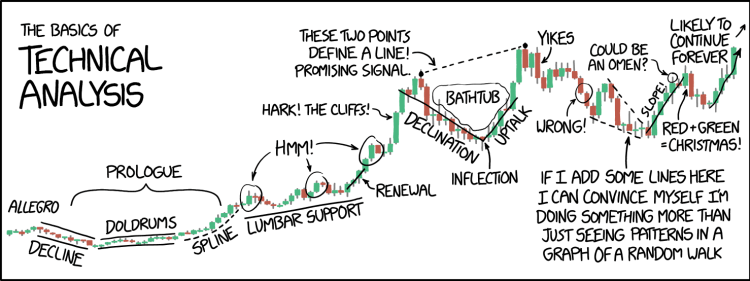
Image Source: https://xkcd.com/2101/
At the turn of the century, the Dow Theory laid the foundations for what was later to become modern technical analysis. Dow Theory was not presented as one complete amalgamation but rather pieced together from the writings of Charles Dow over several years. Of the many theorems put forth by Dow, three stand out:
- Price discounts everything: This theorem is similar to the strong and semi-strong forms of market efficiency. Technical analysts believe that the current price fully reflects all information. Because all information is already reflected in the price, it represents the fair value and should form the basis for analysis. After all, the market price reflects the sum knowledge of all participants, including traders, investors, portfolio managers, buy-side analysts, sell-side analysts, market strategist, technical analysts, fundamental analysts, and many others. It would be folly to disagree with the price set by such an impressive array of people with impeccable credentials. Technical analysis utilizes the information captured by the price to interpret what the market is saying with the purpose of forming a view on the future.
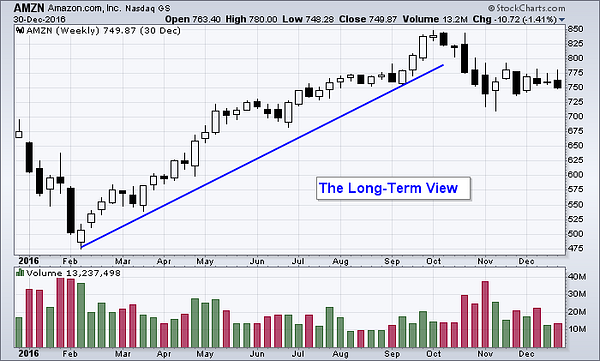
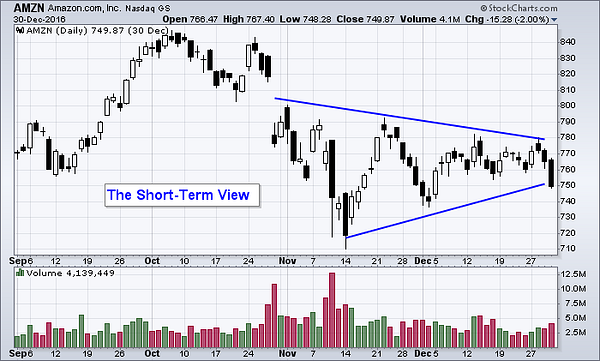
- Price movements are not totally random: Most technicians agree that prices trend. However, most technicians also acknowledge that there are periods when prices do not trend. If prices were always random, it would be extremely difficult to make money using technical analysis. In his book, Schwager on Futures: Technical Analysis, Jack Schwager states:
“One way of viewing the situation is that markets may witness extended periods of random fluctuation, interspersed with shorter periods of nonrandom behavior… The goal of the chart analyst is to identify those periods (i.e. major trends).”
A technician believes that it is possible to identify a trend, invest or trade based on the trend and make money as the trend unfolds. Because technical analysis can be applied to many different timeframes, it is possible to spot both short-term and long-term trends. The IBM chart illustrates Schwager’s view on the nature of the trend. The broad trend is up, but it is also interspersed with trading ranges. In between the trading, ranges are smaller uptrends within the larger uptrend. The uptrend is renewed when the stock breaks above the trading range. A downtrend begins when the stock breaks below the low of the previous trading range.
- “What” is more important than “Why”: In his book, The
Psychology of Technical
Analysis,
Tony Plummer paraphrases Oscar Wilde by stating,
“A technical analyst knows the price of everything, but the value of nothing”. Technicians, as technical analysts are called, are only concerned with two things:- What is the current price?\
- What is the history of the price movement?
The price is the end result of the battle between the forces of supply and demand for the company’s stock. The objective of the analysis is to forecast the direction of the future price. By focusing on price and only price, the technical analysis represents a direct approach. Fundamentalists are concerned with why the price is what it is. For technicians, the “why” portion of the equation is too broad and many times the fundamental reasons given are highly suspect. Technicians believe it is best to concentrate on what and never mind why. Why did the price go up? There were simply more buyers (demand) than sellers (supply). After all, the value of any asset is only what someone is willing to pay for it. Who needs to know why?
Conclusion
Algorithmic Trading has become very popular over the past decade. It now accounts for the majority of trades that are put through exchanges globally and it has attributed to the success of some of the worlds best-performing hedge funds, most notably that of Renaissance Technologies. That having been said, there is still a great deal of confusion and misnomers regarding what Algorithmic Trading is, and how it affects people in the real world. To some extent, the same can be said for Artificial Intelligence.
Too often research into these topics is focussed purely on performance and we forget that it is equally important that researchers and practitioners build stronger and more rigorous conceptual and theoretical models upon which we can further the field in years to come. Whether we like it or not, algorithms shape our modern day world and our reliance on them gives us the moral obligation to continuously seek to understand them and improve upon them. I leave you with a video entitled “How Algorithms shape our world” by Kevin Slavin.
Reference
1.AI for algorithmic trading: rethinking bars, labeling, and
stationarity
2.Algorithmic Trading System
Architecture
3.Validating Machine Learning and AI Models in Financial
Services
4.Machine Learning and AI for trading &
execution
[Whitepaper]
5.Basics of Algorithmic Trading: Concepts and
Examples
6.AI for algorithmic trading: 7 mistakes that could make me
broke
7.Trading Systems and
Methods
[Book]
8.High-frequency trading simulation with Stream
Analytics
9.Components of an FX Trading
Pattern
10.Quantopian video lecture series to get started with
trading [must watch]
11.Zerodha’s varsity set of lecture notes to learn the essentials of
trading