Data Engineering 101 for Dummies like Me

Let’s start with the why, as I move from one blog post to another I feel
like I’m missing something, the more and more I become proficient as a
Data Scientist, the more convinced I am that Data Engineering is one
of the most critical and foundational skills in any data scientist’s
toolkit. In my earlier
posts in this “101 for
dummies like Me” series, I talked about
PyTorch
& Deep
Learning
basics and how one can get started. I believe every data scientist
should know enough about data engineering to carefully evaluate how
their skills are aligned with the stage and need of their company.
Despite its importance, education in data engineering has been limited.
Given its nascency, in many ways, the only feasible path to get training
in data engineering is to learn on the job, and it can sometimes be too
late. I am very fortunate that I get to work with Data Engineers who are
patient enough to help me get started in this nascent field, but not
everyone has the same opportunity. As a result, I have written up this
101 guide on Data Engineering, to summarize what I learned to help
bridge the gap.
The Data Science Hierarchy of Need
Think of Artificial Intelligence as the top of apyramid of needs*. Yes, self-actualization (AI) is great, but you first need food, water, and shelter (data literacy, collection, and infrastructure).
*Monica Rogati’s call-out in “The AI Hierarchy of Needs”
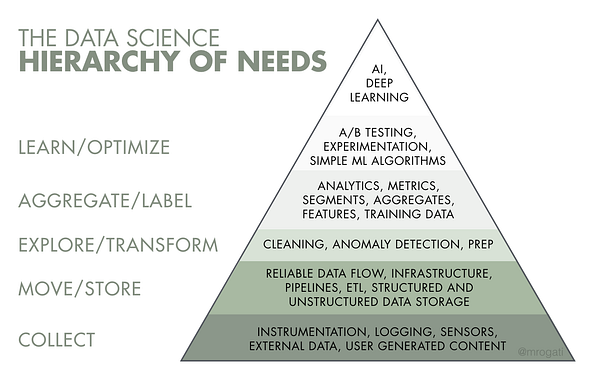
Image Source: https://hackernoon.com/the-ai-hierarchy-of-needs-18f111fcc007
This framework(left) puts things into perspective. Before a company can
optimize the business more efficiently or build data products more
intelligently, layers of foundational work need to be built first. This
process is analogous to the journey that a man must take care of
survival necessities like food or water before he can eventually
self-actualize. Unfortunately, many companies do not realize that most
of our existing data science training programs, academic or
professional, tend to focus on the top of the pyramid knowledge. Even
for courses that encourage students to
scrape, prepare, or access raw data through public APIs, most of them do
not teach students how to properly design table schemas or build data
pipelines. As a result, some of the critical elements of real-life data
science projects were lost in translation.
We should not go as far as arguing that every data scientist needs to
become an expert in data engineering. However, I do think that every
data scientist should know enough of the basics to evaluate project and
job opportunities in order to maximize talent-problem fit. If you find
that many of the problems that you are interested in solving require
more data engineering skills, then it is never too late then to invest
more in learning data engineering, which is something I started doing
recently.
What is data, and Structured vs. Unstructured Data?
In computing, data is information that has been translated into a form that is efficient for movement or processing. Relative to today’s computers and transmission media, data is information converted into binary digital form. It is acceptable for data to be used as a singular subject or a plural subject. Raw data is a term used to describe data in its most basic digital format.
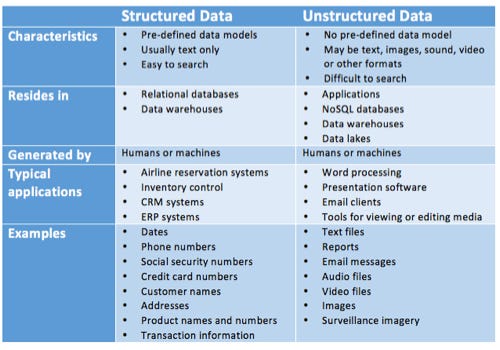
The difference between structured and unstructured data is that structured data is objective facts and numbers that most analytics software can collect, making it easy to export, store and organize in typical databases like Excel, Google Sheets, and SQL. You can also easily examine structured data with standard data analysis methods and tools like regression analysis and pivot tables.
On the contrary, unstructured data is usually subjective opinions and judgments of your brand in the form of text, which most analytics software can’t collect, making it difficult to export, store, and organize in typical databases. You also can’t examine unstructured data analysis methods and tools. Most of the time, you must store unstructured data in Word documents or NoSQL databases and manually analyze it or use the analysis tools in a NoSQL database to examine this type of data.
In a world where Google Analytics can spit out every metric under the sun, you must remember that qualitative data, like customer feedback, is just as crucial for informing your marketing strategy as web metrics. Without unstructured data, you won’t have a clear understanding of how your customers actually feel about your brand. And that’s crucial for every marketer to know.
Building Data Warehouses
Maxime Beauchemin, the original author of Airflow, characterized data engineering in his fantastic post The Rise of Data Engineer:
Data engineering field could be thought of as a superset of business intelligenceand data warehousing that brings more elements from software engineering. This discipline also integrates specialization around the operation of so called “big data” distributed systems, along with concepts around the extended Hadoop ecosystem, stream processing, and in computation at scale.
Image Source: https://halobi.com/products/halo-platform/data-warehousing/
Among the many valuable things that data engineers do, one of their highly sought-after skills is the ability to design, build, and maintain data warehouses. Just like a retail warehouse is where consumable goods are packaged and sold, a data warehouse is a place where raw data is transformed and stored in query-able forms. In many ways, data warehouses are both the engine and the fuels that enable higher level analytics, be it business intelligence, online experimentation, or machine learning. Without these data warehouses, every activity related to data science becomes either too expensive or not**scalable. For example, without a properly designed business intelligence warehouse, data scientists might report different results for the same basic question asked at best; At worst, they could inadvertently query straight from the production database, causing delays or outages. Similarly, without an experimentation reporting pipeline, conducting experiment deep dives can be extremely manual and repetitive. Finally, without data infrastructure to support label collection or feature computation, building training data can be extremely time-consuming.
Cloud vs On-premise data storage
The biggest decision is whether to have a cloud-based or in-house server infrastructure. While it may sound like a black-or-white selection, there are many things to consider. The first factor is how important uptime is to your business. Cloud solutions are usually more expensive than in-house, but the benefits of being in the cloud can far outweigh the costs for some businesses. For example, an online business that is reliant on web-based transactions will consider uptime an extremely important factor; therefore, they will likely be willing to pay more for a cloud-based solution that can guarantee a certain level of uptime. Other businesses not as dependent on uptime may be more suited to an in-house setup.
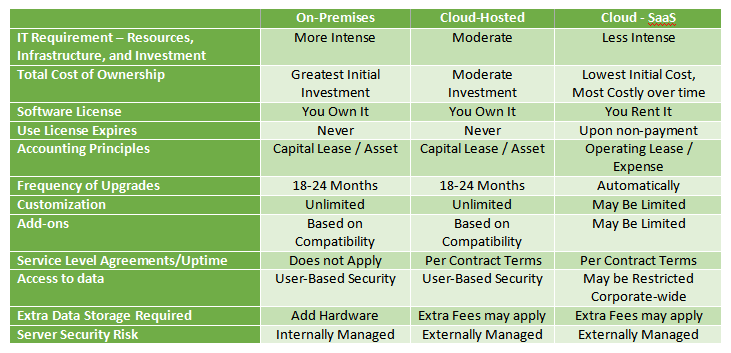
Image Source: https://www.rklesolutions.com/blog/erp-cloud-cheat-sheet
A third option, however, is hybrid data storage. Rather than choosing between on-premises and cloud solutions, why not use both? Hybrid data storage offers the best of both worlds by using both storage solutions. A common example of hybrid data storage is when an organization stores its primary data on a local server but stores backup copies on the cloud. Granted, this is more costly than simply choosing a single storage option, but it also protects against unforeseen disasters. If a fire or flood occurs at the organization’s server room, it could destroy their locally stored on-premises data. Since the organization’s backups are stored on the cloud, however, they can restore their lost data with minimal interruption.
There are pros and cons associated with each data storage solution. On-premises requires a substantial monetary investment but also offers the highest level of security; cloud storage is affordable, scalable and can be accessed over the internet, and hybrid brings them both together. Consider your organization’s short- and long-term needs and choose the data storage option that’s best suited.
ETL: Extract, Transform, and Load
Before collected data can be analyzed and leveraged with predictive methods, it needs to be organized and cleaned. Data Engineers begins this process by making a list of what data is stored, called a data schema. Next, they need to pick a reliable, easily accessible location, called a data warehouse, for storing the data. Examples of data warehousing systems include Amazon Redshift or Google Cloud. Finally, Data Engineers create ETL (Extract, Transform and Load) processes to make sure that the data gets into the data warehouse. These three conceptual steps are how most data pipelines are designed and structured. They serve as a blueprint for how raw data is transformed to analysis-ready data. To understand this flow more concretely, refer below image:
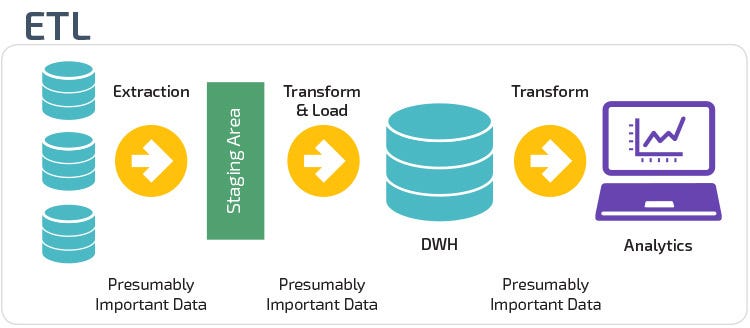
Image Source: https://panoply.io/data-warehouse-guide/3-ways-to-build-an-etl-process/
- Extract: this is the step where sensors wait for upstream data sources to land (e.g. an upstream source could be machine or user-generated logs, relational database copy, external dataset, etc). Upon available, we transport the data from their source locations to further transformations.
- Transform: This is the heart of any ETL job, where we apply business logic and perform actions such as filtering, grouping, and aggregation to translate raw data into analysis-ready datasets. This step requires a great deal of business understanding and domain knowledge.
- Load: Finally, we load the processed data and transport them to a final destination. Often, this dataset can be either consumed directly by end-users or it can be treated as yet another upstream dependency to another ETL job, forming the so-called data lineage.
While all ETL jobs follow this common pattern, the actual jobs themselves can be very different in usage, utility, and complexity. For example, we could have an ETL job that extracts a series of CRUD operations from a production database and derive business events such as a user deactivation. Another ETL can take in some experiment configuration file, compute the relevant metrics for that experiment, and finally output p-values and confidence intervals in a UI to inform us whether the product change is preventing from user churn. Yet another example is a batch ETL job that computes features for a machine learning model on a daily basis to predict whether a user will churn in the next few days. The possibilities are endless!
ETL Vs ELT: The Difference Is In The How
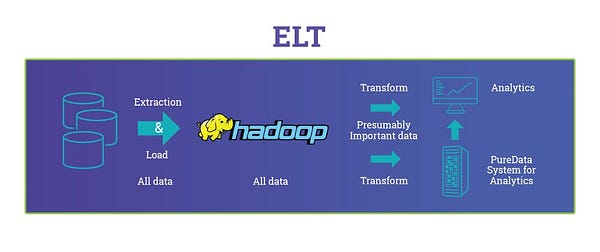
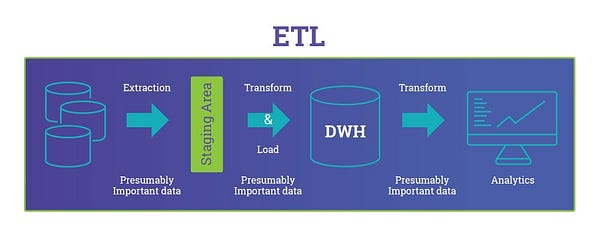
Image Source: https://blog.panoply.io/etl-vs-elt-the-difference-is-in-the-how
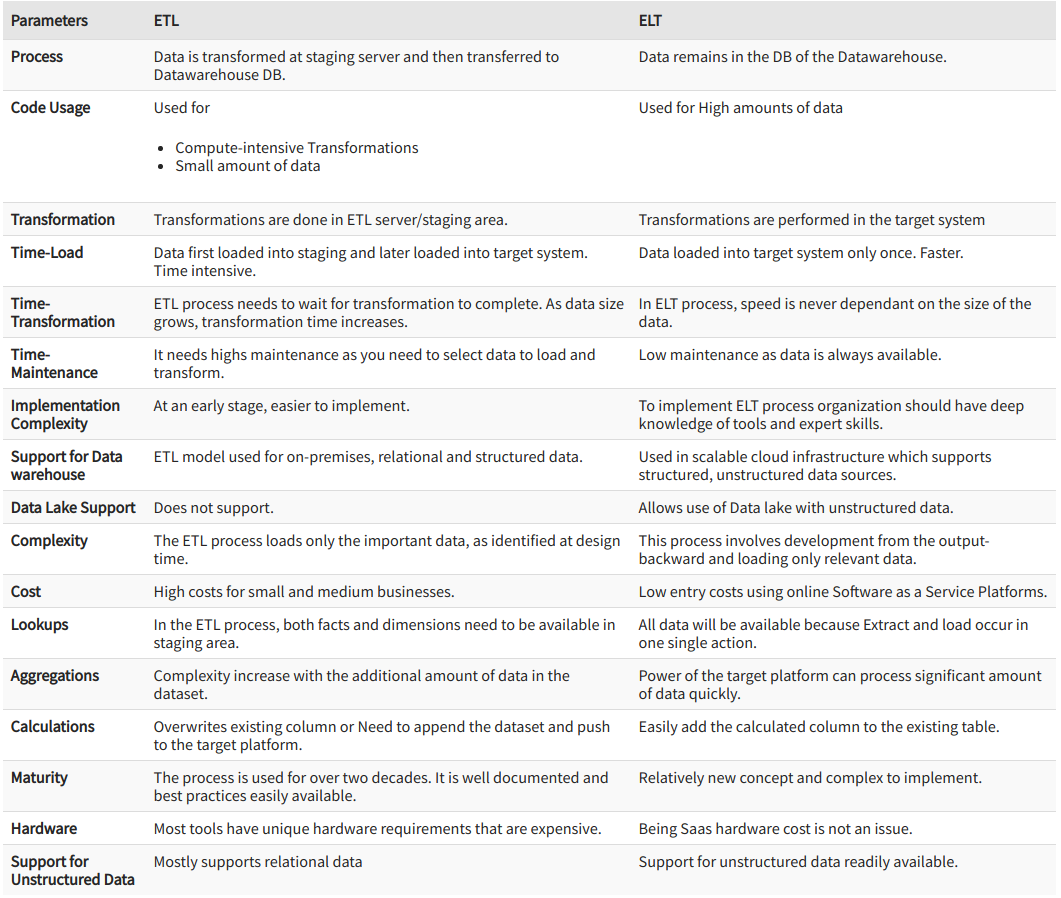
Image Source: https://www.guru99.com/etl-vs-elt.html
ELT should be used, instead of ETL, in these various cases :
- There are big volumes of data
- The source database and the target database are the same
- The database engine is well adapted for that kind of processing, such as PDW, which is great at loading massive amounts of data very quickly
So in short, when using ETL the transformations are processed by the ETL
tools, while in ELT the transformations are processed by the target data
source.
ELT has the benefit of minimizing the processing on the source since no
transforming is being done, which can be extremely important if the
source is a production system where you could be impacting the user
experience as opposed to a copy of the source (via replication, database
snapshot, etc). The negative of this approach is it may take longer to
get the data into the data warehouse as with the staging tables you have
an extra step in the process, and you will need more disk space for the
staging tables.
OLTP vs OLAP
OLTP is said to be more of an online transactional system or data storage system, where the user does lots of online transactions using the data store. It is also said to have more ad-hoc reads/writes happening on a real-time basis. OLAP is more of an offline data store. It is accessed a number of times in offline fashion. For example, Bulk log files are read and then written back to data files. Some of the common areas where OLAP is used are Log Jobs, Data mining Jobs, etc. Cassandra is said to be more of OLTP, as it is real-time, whereas Hadoop is more of OLAP since it is used for analytics and bulk writes.
What is Data Modeling, Normalization, and Star Schema all about?
Data modeling is the process of producing a descriptive diagram of relationships between various types of information that are to be stored in a database. One of the goals of data modeling is to create the most efficient method of storing information while still providing for complete access and reporting.
A data model describes information in a systematic way that allows it to be stored and retrieved efficiently in a Relational Database Management System (RDBMS), such as SQL Server, MySQL, or Oracle. The model can be thought of as a way of translating the logic of accurately describing things in the real-world and the relationships between them into rules that can be followed and enforced by computer code.
Data normalization is the process of structuring a schema to avoid dependencies that create anomalies when new data is inserted or updated. The idea behind normalization is to ensure that data can always be queried reliably. Most commonly, this involves reducing data stores to a point where no duplicate data is contained within them. By ensuring the discrete storage of data points, the model can offer more efficient storage of information while avoiding scenarios where contradictory data might be stored. Although in terms of data storage a normalized model is inherently the most efficient, for some operational purposes, a fully normalized database can result in a sub-par performance. So data modelers commonly also engage in strategic denormalization, breaking normalization rules to optimize certain query or update processes to speed up the RDBMS.
The implementation of a data warehouse and business intelligence model involves the concept of Star Schema as the simplest dimensional model. Similar to every other dimensional model, star schema consists of data in the form of facts and dimensions. The reason behind the name ‘Star Schema’ is that this data model resembles a star with ends radiating from the center, where the center refers to the fact table and the radiating points are dimension tables.
Relational DataBase Management System
A relational database management system (RDBMS) is a collection of
programs and capabilities that enable IT teams and others to create,
update, administer and otherwise interact with a relational database.
Most commercial RDBMSes use Structured Query Language (SQL) to access
the database, although SQL was invented after the initial development of
the relational model and is not necessary for its use.
In general, databases store sets of data that can be queried for use in
other applications. A database management system supports the
development, administration, and use of database platforms. An RDBMS is
a type of DBMS with a row-based table structure that connects related
data elements and includes functions that maintain the security,
accuracy, integrity, and consistency of the data.
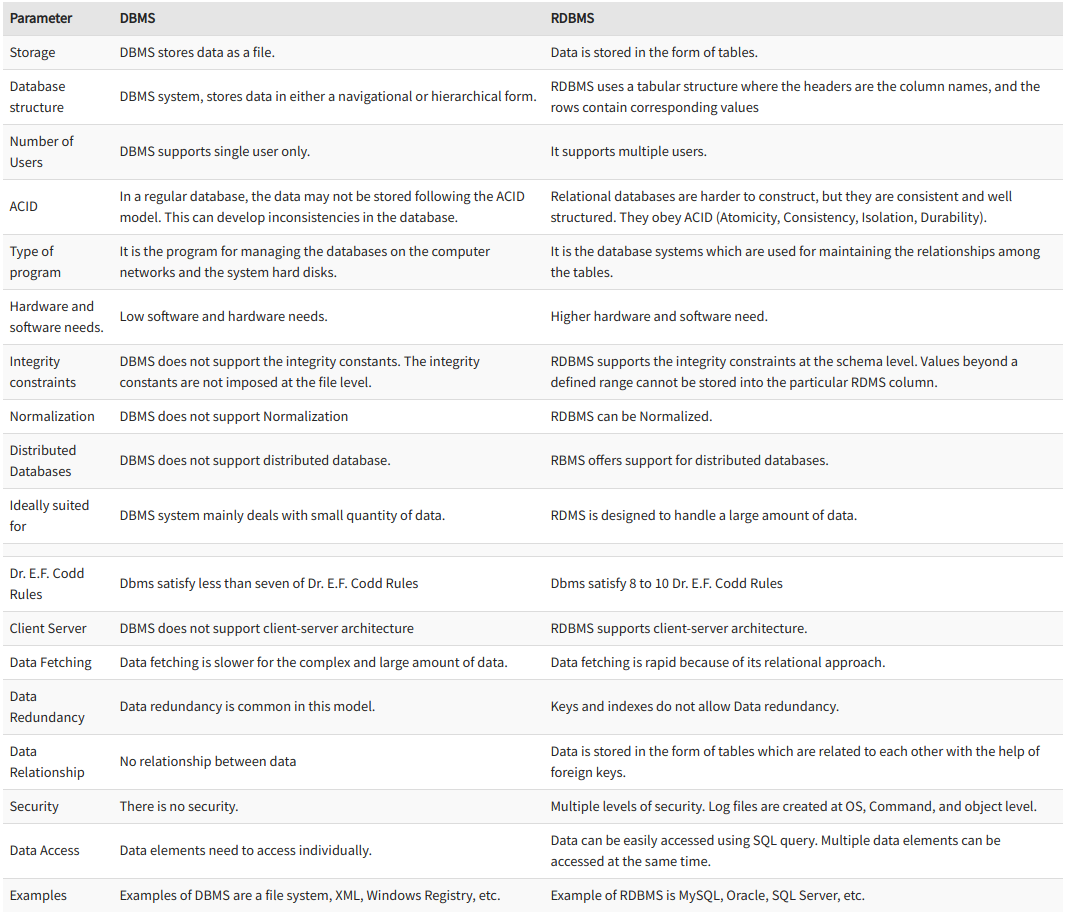
Image Source: https://www.guru99.com/difference-dbms-vs-rdbms.html
Numerous RDBMSes arose along with the use of client/server computing. Among the competitors were Oracle, Ingres, Informix, Sybase, Unify, Progress and others. Over time, three RDBMSes came to dominate in commercial implementations. Oracle, IBM’s DB2 and Microsoft’s SQL Server, which was based on a design originally licensed from Sybase, found considerable favor throughout the client/server computing era, despite repeated challenges by competing technologies. As the 20th century drew to an end, lower-cost, open source versions of RDBMSes began to find use, particularly in web applications. Such systems included MySQL and PostgreSQL.
Eventually, as distributed computing took greater hold and as cloud architecture became more prominently employed, RDBMSes met competition in the form of NoSQL systems. Such systems were often specially designed for massive distribution and high scalability in the cloud, sometimes forgoing SQL-style full consistency for so-called eventual consistencyof data. But, even in the most diverse and complex cloud systems, the need for some guaranteed data consistency requires RDBMSes to appear in some way, shape or form. Moreover, versions of RDBMSes have been significantly restructured for cloud parallelization and replication.
Design Patterns For Data Engineering Frameworks
As useful as they are, DE frameworks are rarely born out of thin air. An
Airbnb’s data engineer quoted in the source video mentioned below:
“There really is no magic, when you have done certain task enough
times, you started to see patterns that can be automated.” When you see
your work as workflows, new possibilities arise.
When thinking about which workflow to automate, the framework designer
needs to start by thinking about the end user’s experience. There are
generally three layers of a well-designed data engineering framework:
the inputlayer, the data processinglayer, and the
outputlayer.
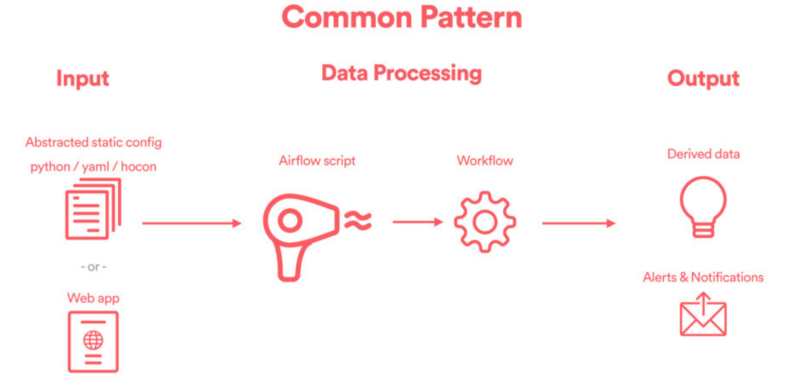
Image Source: https://www.youtube.com/watch?v=bCKt-MfMXt8&t=2m
- Input: This is where an end user specifies how their DAGs should be configured. User experience really matters here. Typically, the input could be a static configuration file (e.g. YAML or HOCON), or it could be something as elaborate as a web UI. The goal here is to capture user needs.
- Data Processing: This is the core of any data engineering framework, where ETL pipelines are instantiated dynamically. The code that achieves this is generally referred to as a DAG factory, which whimsically captures the notion that DAGs are being created one at a time, like in a factory.
- Output:The DAGs generated from the previous step create derived data, and the output is often saved in a downstream Hive table, presented in a well-designed UI / visualization layer, or simply consumed by downstream pipelines or frameworks.
Processing Large scale data
So, once you have your entire workflow automated using AriFLow, and are handling big data, you need to use Apache Spark to do Pre-processing on them. On its website, Apache Spark is explained as a ‘fast and general engine for large-scale data processing’. But that doesn’t even begin to encapsulate the reason it has become such a prominent player in the big data space. Its adoption by big data companies has been on the rise at an eye-catching rate. Understanding the reasons behind Spark’s rise can help predict the trajectory of upcoming big data solutions.
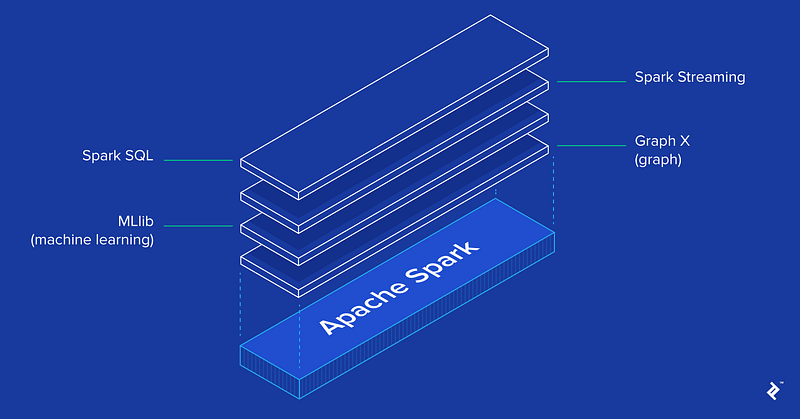
The Spark core is complemented by a set of powerful, higher-level libraries which can be seamlessly used in the same application. These libraries currently include SparkSQL, Spark Streaming, MLlib (for machine learning), and GraphX, each of which is further detailed in this article. Additional Spark libraries and extensions are currently under development as well.
Conclusion
In this post, I covered data engineering and the skills needed to
practice it at a high level. If you’re interested in architecting
large-scale systems or working with huge amounts of data, then data
engineering is a good field for you. It can be very exciting to see your
autoscaling data pipeline suddenly handle a traffic spike, or get to
work with machines that have terabytes of RAM. There’s satisfaction in
building a robust system that can work for months or years with minimal
tweaking.
Because data engineering is about learning to deal with scale and
efficiency, it can be hard to find good practice material on your own.
But don’t give up hope — it’s very possible to learn data engineering on
your own and get a job in the field.
Reference
- A guide to becoming a Data Engineer
- What is data actually?
- The Data Science Industry: Who Does What (Infographic)
- Data Scientist Vs. Data Engineer
- What Is Data Warehousing?
- What is Data Lake? It’s Architecture
- OLTP vs OLAP: What’s the Difference?
- RDBMS vs DBMS
- Why Do I Need a Star Schema?
- Data Mart Tutorial: What is Data Mart, Types & Example
- What is Data Modelling? Conceptual, Logical, & Physical Data Models
- Use case of Apache Spark